Clinic & BCBA
Behavior Reduction Graph Pack
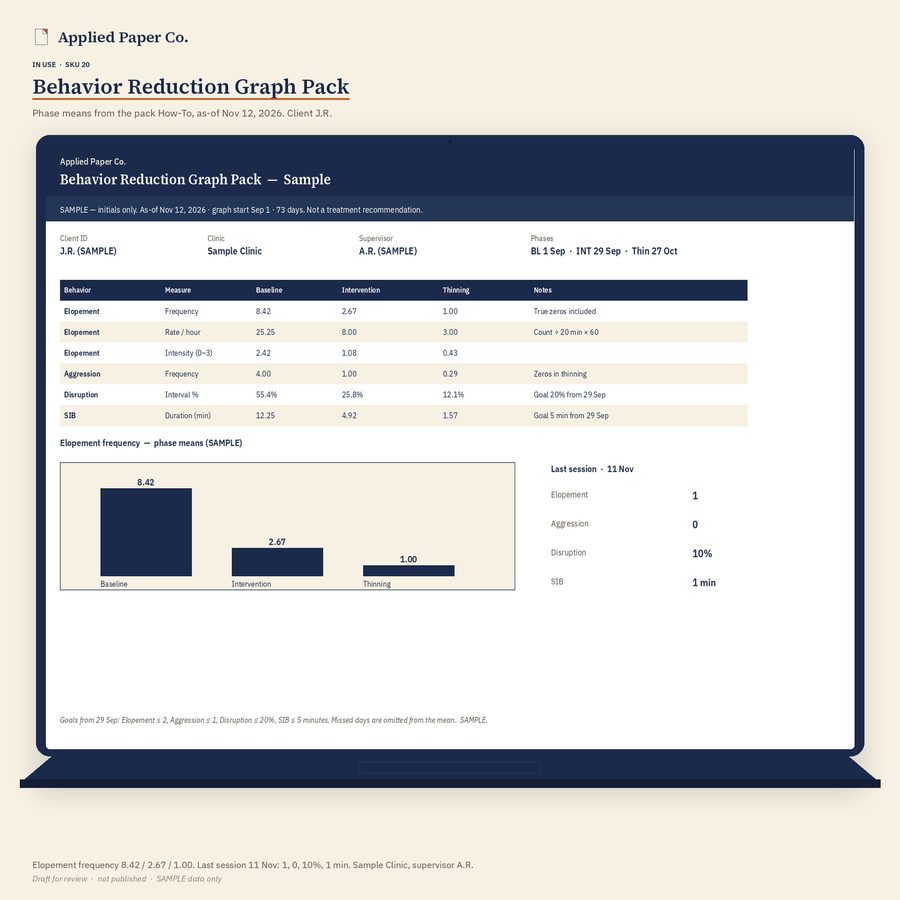
A graphing workbook for problem-behavior measures a clinic or school BCBA already collects. Enter session counts, minutes, duration, interval, or intensity, and the file draws line graphs with phase-change marks and goal lines, a four-behavior overlay, and a time-of-day scatterplot. Missed days are skipped on the chart; a measured zero plots as zero.
$19.99
Price matches our Teachers Pay Teachers listing. Etsy price: $21.99. Instant digital download.
One-teacher or one-caseload license. License details
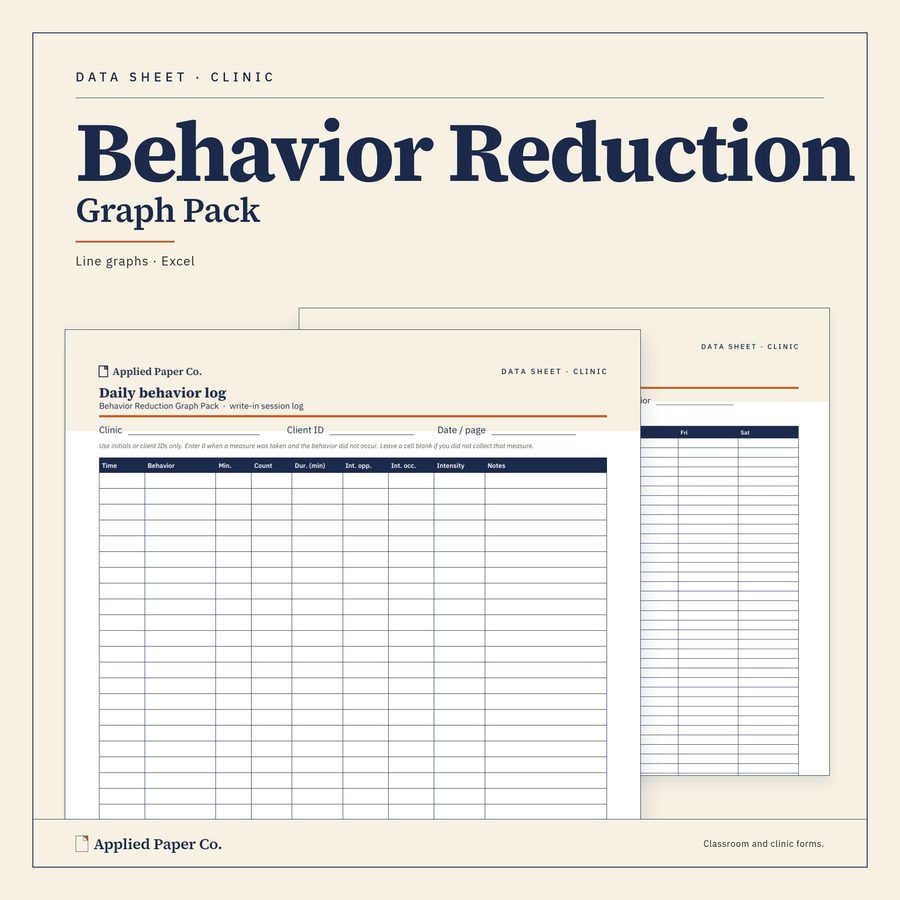
Includes a printable daily log, a 15-minute time-of-day grid, a phase-means report page, Excel and Google Sheets, and a How-To. This is a graphing toolkit only — it does not determine function, mastery, or medical necessity, and it is not a standardized assessment. Use initials or client IDs only — do not enter protected health information.
This complements our skill progress graphs and our session column charts. Use this pack when you need line graphs and a scatterplot for behavior reduction.
What's included
8 files in one zip download.
- Behavior Daily Log — printable PDF in color and black-and-white
- Behavior time-of-day Grid — printable PDF in color and black-and-white
- How-To page (PDF)
- Excel workbook
- Google Sheets version (upload the file to your own Drive)
- README with Google Sheets import steps
Digital download only; nothing ships. If a file is damaged or won't open, email us and we'll replace it. Refund policy.
More Clinic & BCBA tools
Back to the shop